
US Value Stock Screener:
- Average Volume 30 Day > 20M
- Price x Volume > 10M
- Market Cap >= 200 B
- Price >= $20
- Analyst Rating: Buy and Strong Buy
- Revenue growth, Quarterly YOY > 10%
- Exchange: Nasdaq, NYSE, NYSE Arca
- Index: Within any Index
- Registration: United States
US Stock Screener:
- Average Volume 30 Day > 1M
- Price x Volume > 10M
- Market Cap >= 10 B
- Price >= $20
- Analyst Rating: Buy and Strong Buy
- Revenue growth, Quarterly YOY > 20%
- Exchange: Nasdaq, NYSE, NYSE Arca
- SMA(20) > SMA(200)
- SMA(50) > SMA(200)
- Price > SMA(50)
- Price > SMA(200)
CA Value Stock Screener:
- Average Volume 30 Day > 1M
- Price x Volume > 10M
- Market Cap >= 10 B
- Price >= $20
- Analyst Rating: Buy and Strong Buy
- Revenue growth, Quarterly YOY > 10%
- Exchange: CSE, NEO, TSX, TSXV
- Index: Within any Index
- Registration: Canada
Entry criteria:
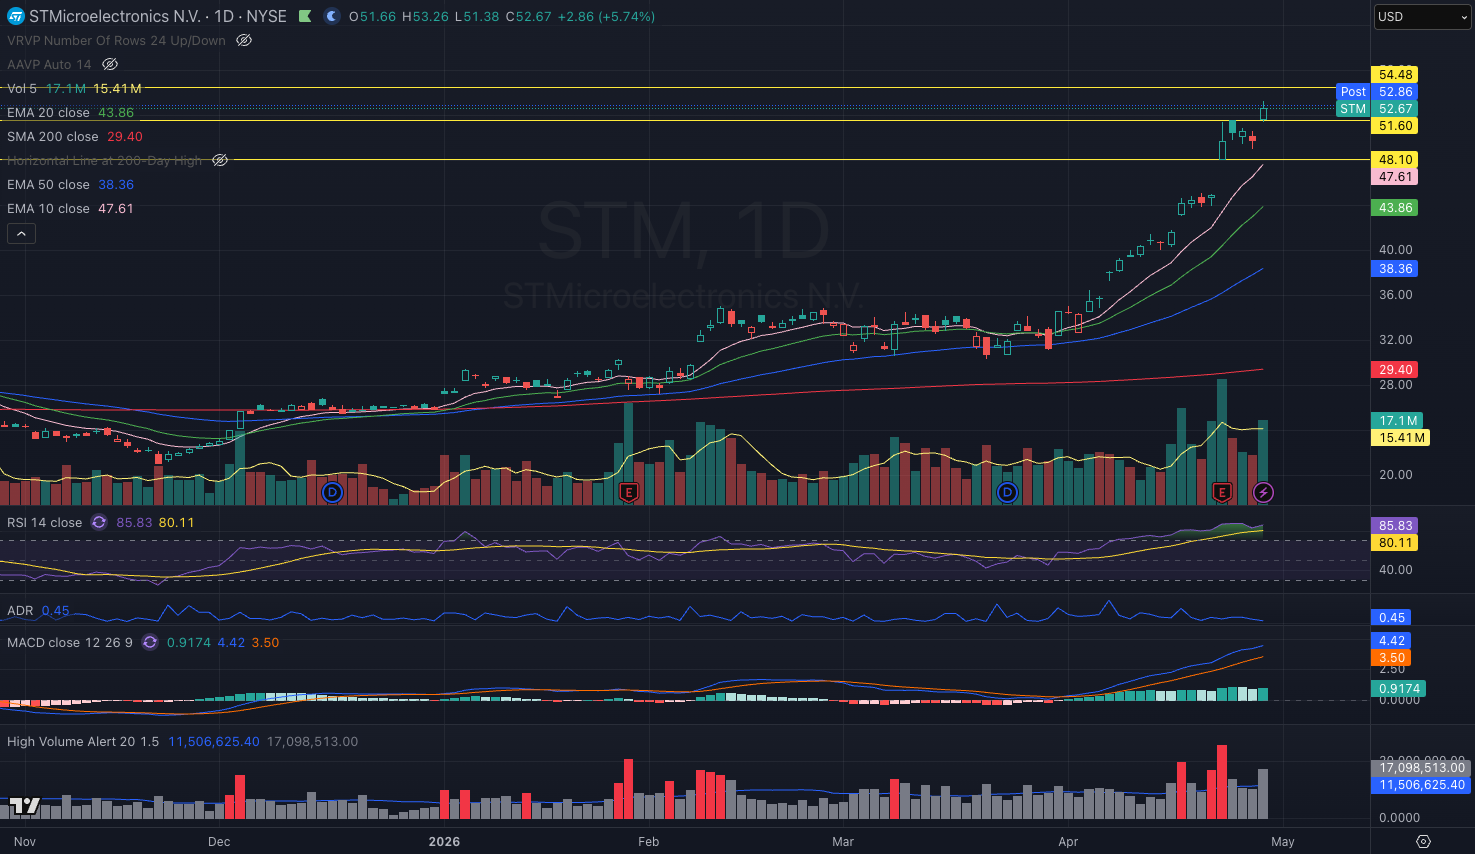
- After the stock gaps up sharply on earnings and then pulls back over the following days, it becomes a buying opportunity once it resumes its upward move and shows renewed momentum.
- MACD is above 0 and has a bullish crossover (crossing upward).
- Trading volume increases compared to the pullback period.
- The closing price is higher than yesterday’s close or a previous resistance high.
Exit criteria:
- Reduce the position by 25% when volume exceeds 1.5 times the 20-day average but the price shows weakness—such as failing to open and close strong or printing a long upper wick. Adjust the stop-loss to the 10-day EMA.
- Reduce the position by 50% when the MACD crosses into negative territory (below the zero line), and adjust the stop-loss to the 50-day EMA.
- Sell half of the position if trading volume exceeds 1.5 times the 20-day average, but the stock fails to break higher at a key resistance level and closes with a doji candle, indicating indecision. Adjust the stop-loss to the intraday low.