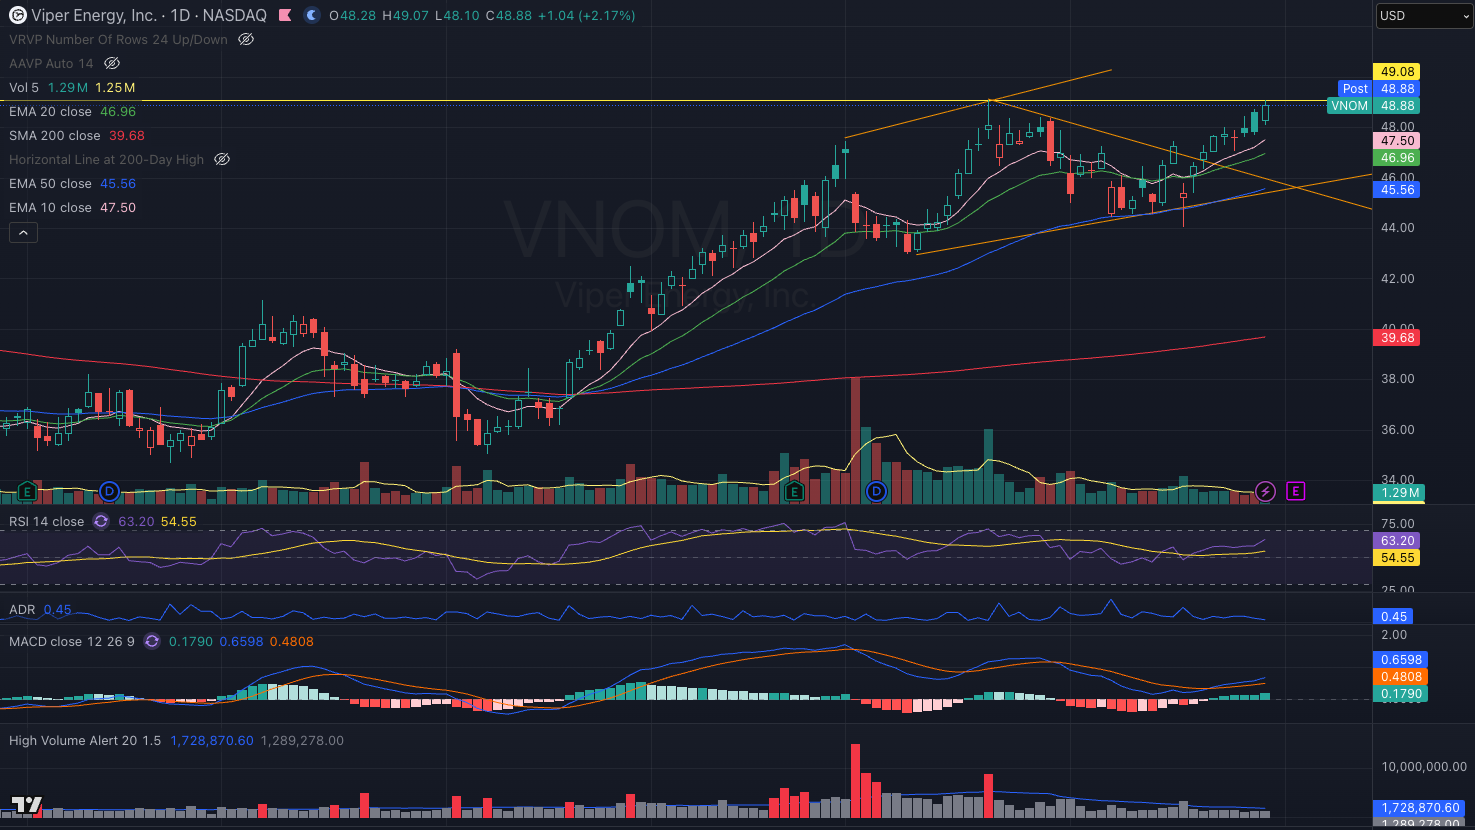
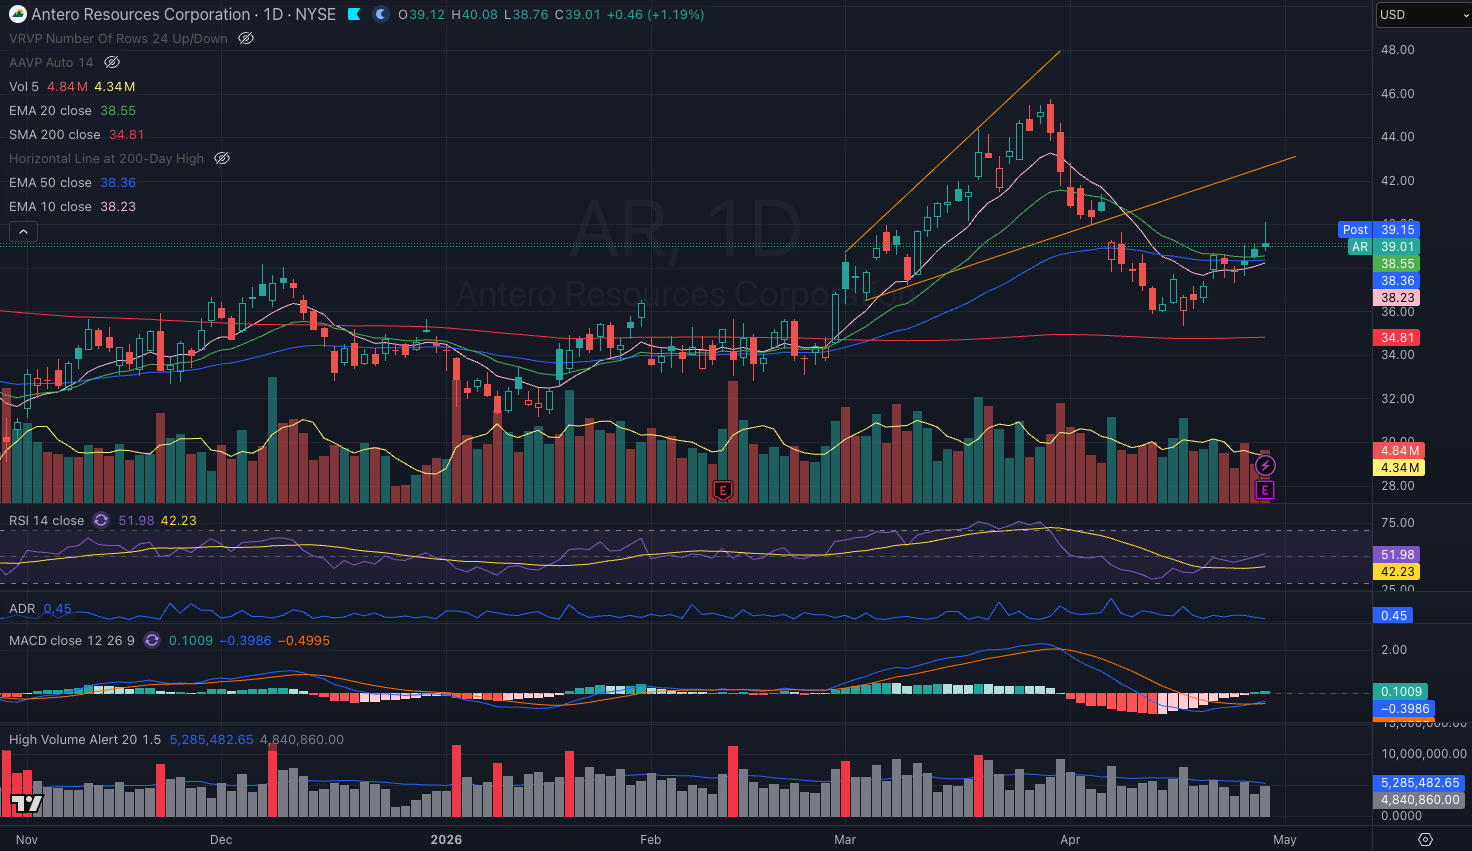
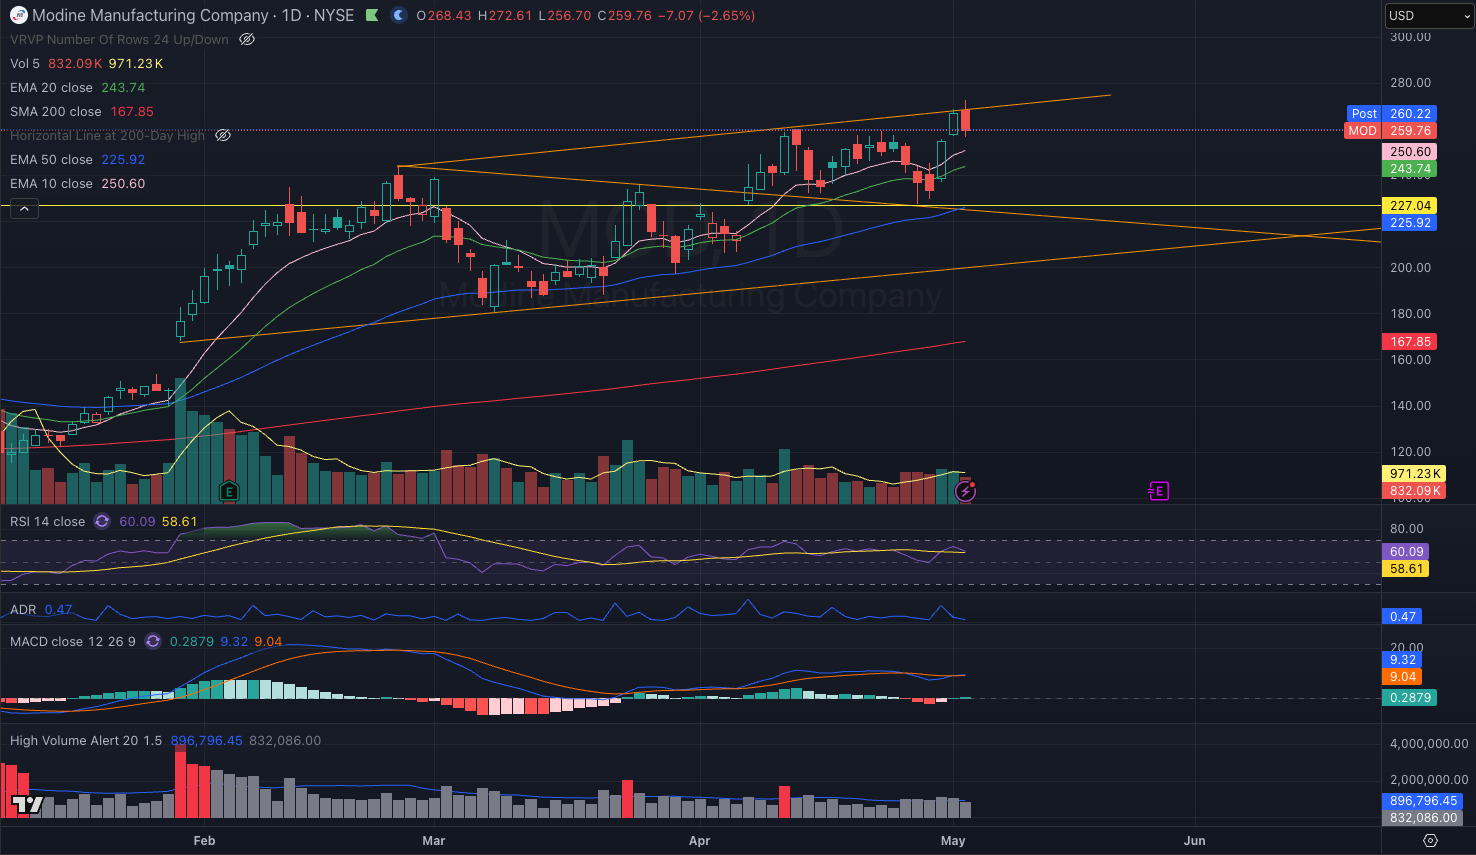
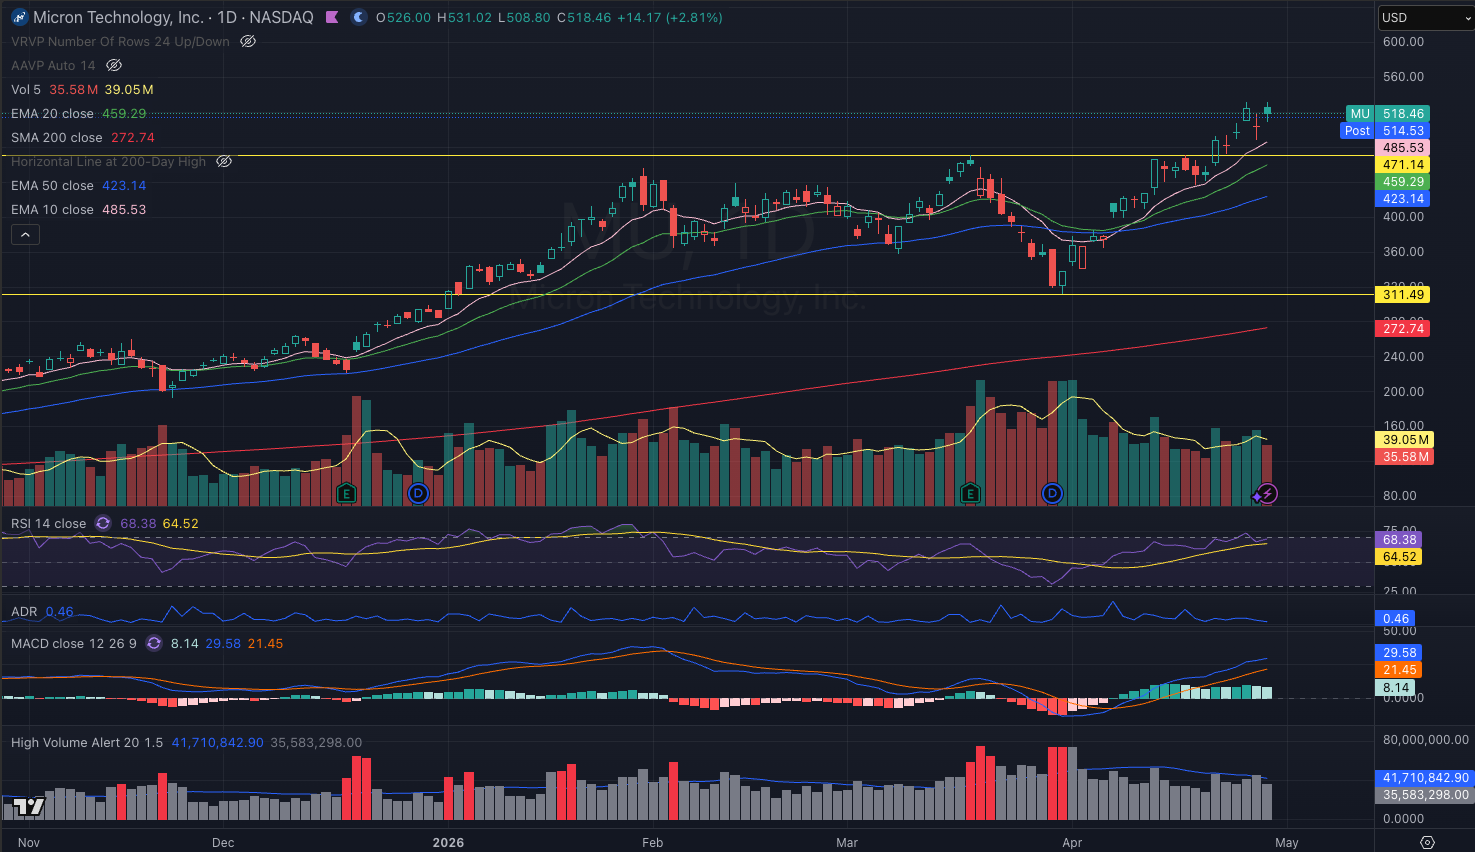
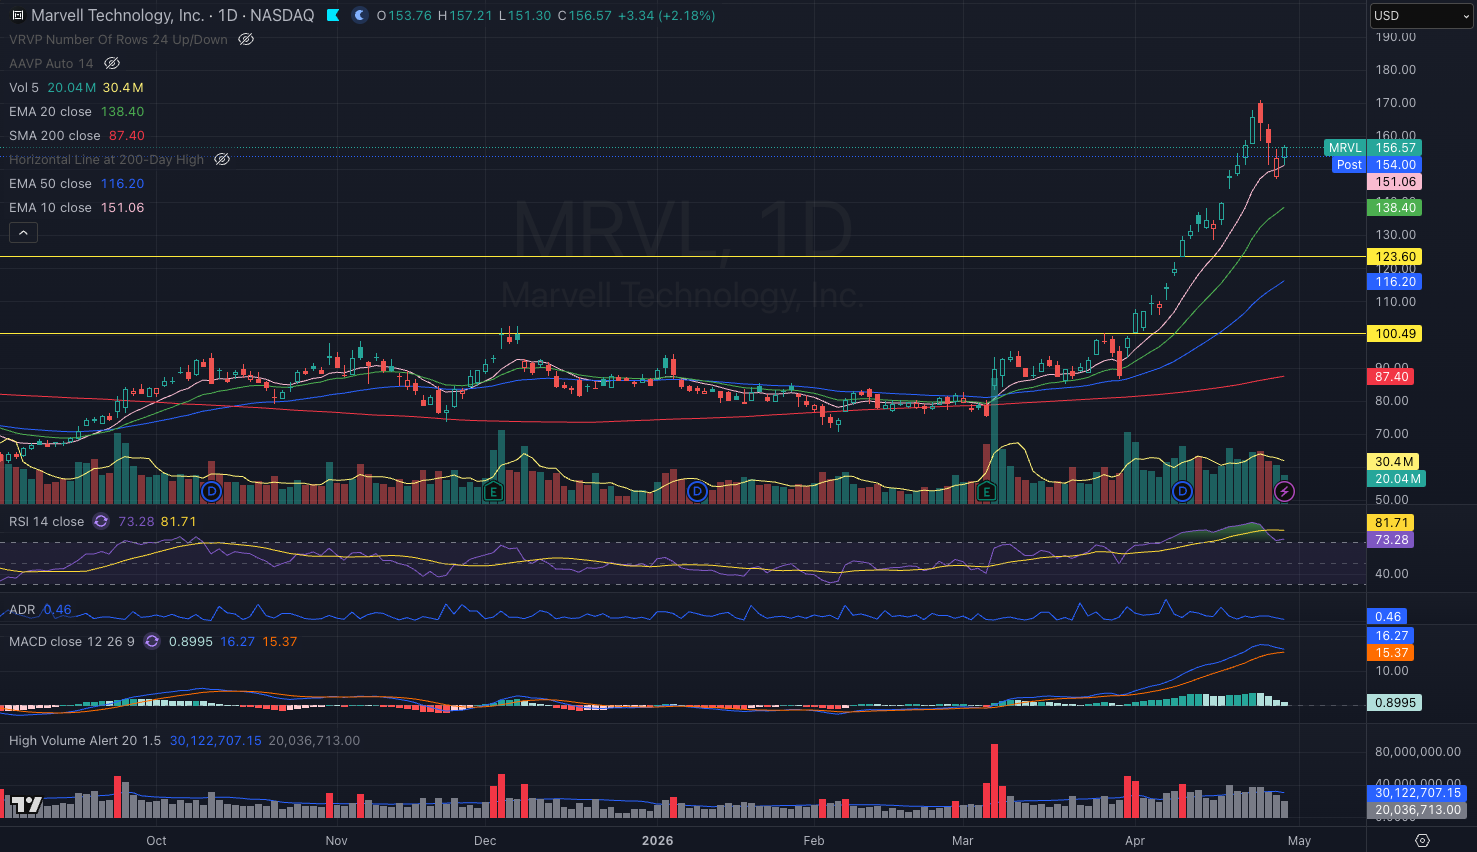
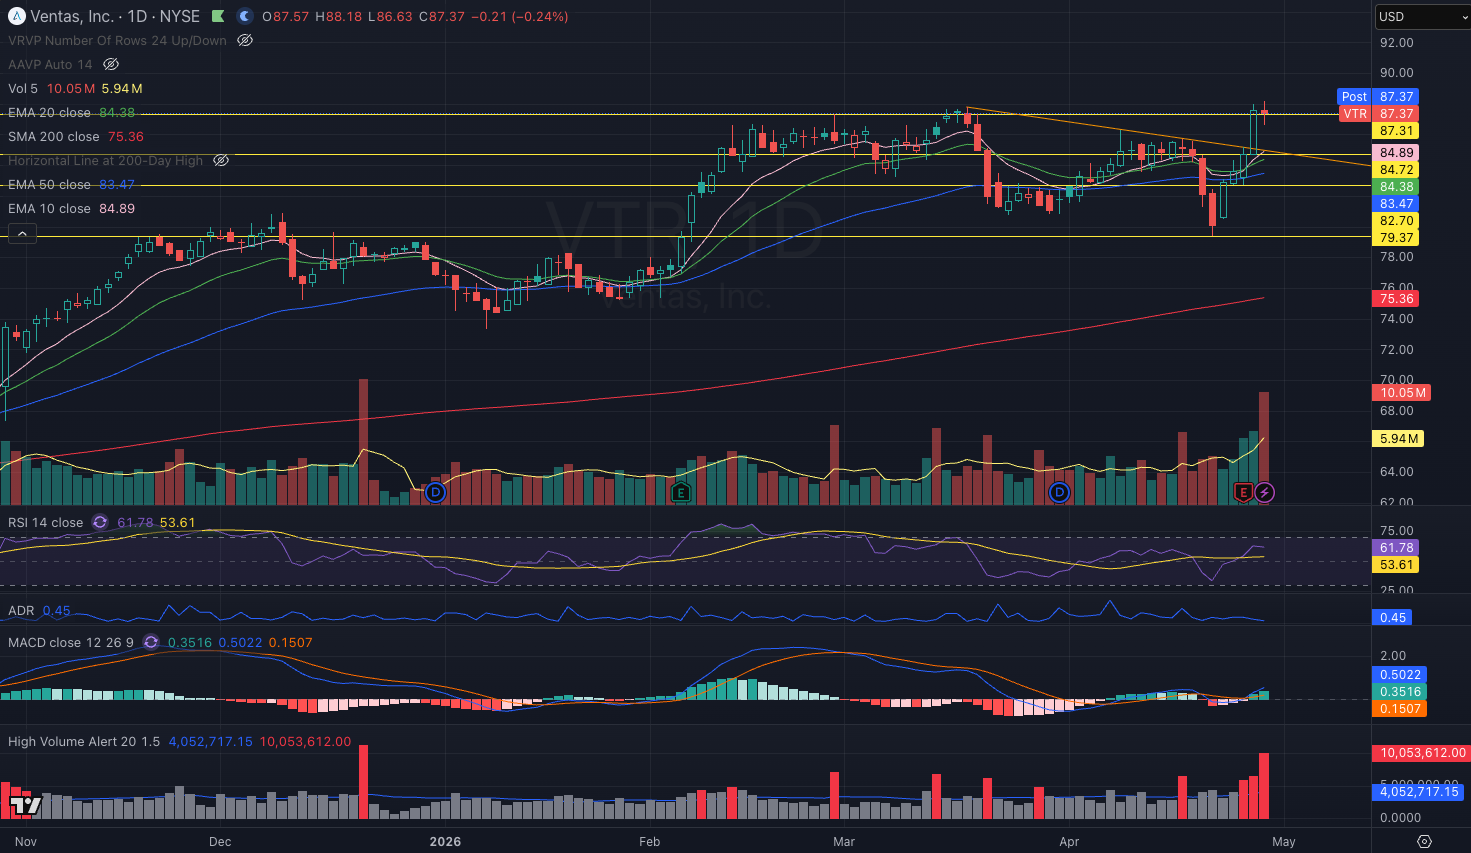
Enter a long position when a stock breaks out with strong volume following an extended consolidation, accompanied by a bullish MACD signal, upward-sloping moving averages, and the price holding above key moving averages. Place the stop-loss at the intraday low.
Good Example:
Bad Example:
Enter a long position when a stock experiences a high-volume breakout following an extended downtrend, with a bullish MACD signal, upward-sloping moving averages, and the price holding above key moving averages. Place the stop-loss at the intraday low.
Exit criteria:
Reduce the position by 25% when volume exceeds 1.5 times the 20-day average but the price shows weakness—such as failing to open and close strong or printing a long upper wick. Adjust the stop-loss to the 10-day EMA.
Reduce the position by 50% when the MACD crosses into negative territory (below the zero line), and adjust the stop-loss to the 50-day EMA.
Sell half of the position if trading volume exceeds 1.5 times the 20-day average, but the stock fails to break higher at a key resistance level and closes with a doji candle, indicating indecision. Adjust the stop-loss to the intraday low.
Sell half of the holdings once the target price is reached. Adjust the stop-loss to the intraday low.
Bought Ventas, Inc. as it somewhat meets Strategy 1 criteria.The stock has been either consolidating sideways or in a short-term downtrend. 👍 Positives MACD has